Yahoo! Pipes is a free online service that lets you remix popular feed types (json, xml, rss, and atom) and create data mashups using a visual editor. You can use Pipes to run your own web projects, or publish and share your own web service without ever having to write a line of code. Pipes also allows you to create feeds from web sites that don't provide RSS/XML by extracting data straight from the HTML document. In this post, we'll talk about how the Pipes editor uses the HTML5 canvas tag extensively, challenges we faced using the canvas tag and a few solutions we came up with to address said challenges.
Pipes is widely known for its visual editor that allows you to drag pre-configured modules onto its canvas and wire them together:

We use the canvas tag to create the fluid, draggable wiring to connect modules. The thumbnails of Pipes on the Browse and My Pipes sections aren't jpegs - we use canvas to "draw" them dynamically from the Pipe definition.


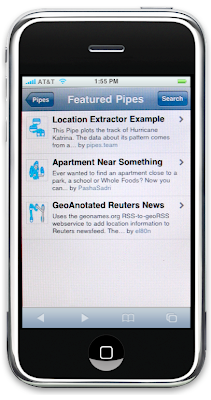
Since the iPhone's web browser supports the canvas tag, we were able to use the same code to generate the thumbnails for our iPhone version.
The Pipes editor is where all the visual programming is done. By dragging modules to the workspace, you can set up a visual workflow of what you want processed. To complete the flow, you need to connect the modules in the sequence you want. At the bottom or top of the modules are terminals, where you connect the wires from one to the other. The terminals are typed, meaning you can only connect an output to an input that has the same type.
The canvas tag is a HTML tag that provides a fixed drawing area that can be used to draw graphics. The tag is manipulated using Javascript to create 2D drawing primitives such as lines, circles, polygons and even gradients. While many browsers support the canvas tag natively, some do not. For example, IE does not support canvas natively. To address this, IE uses a canvas wrapper, excanvas (created by Google) to ensure full cross-browser compatibility.
The canvas tag enabled us to leverage the built-in capabilities of CSS and the DOM for the rest of the interface while still providing us with 2D drawing capabilities. We observed a few issues with the canvas tag that developers should be cognizant of when considering to use it in their applications:
- There are cross-browser issues related to resizing the canvas tag once it's been created. In Firefox you're ok. In Safari, you need to destroy and re-create the region to get the canvas to draw properly. With IE, the region doesn't clear and redraw automatically.
- In the canvas element you can't say, "this line being drawn should be this class". There is no separation between the presentation and the markup. It has to be programmatically done and it's cumbersome to keep tweaking JS code to change the look and feel of what is being rendered. So how do you tell the canvas what style of wire to draw? We chose to use the styles of the source and target terminals to infer the wire styles in their CSS. We put the configuration of the wire style (color, width, thickness etc..) into the background image filename of each terminal which the JavaScript could parse to create a compatible render style for our canvas wires.
- Performance rapidly decreases with size, especially with other overlapping DOM elements such as many transparent elements and other canvas tags. There is a tradeoff therefore between using one canvas tag with many wires or one canvas for each wire. The latter worked better for our usage within the Pipes editor.
- There are no "canvas" events about the "inside" of the canvas, It's just a 2D layer, and mixing DOM elements with canvas has significant event occlusion issues. Even if you are only drawing a wire within the canvas rectangle, anything under the canvas won't see events (mouseover, click etc) as the bounding box acts like any other element. This issue involved the most iterations in our interaction design. Initially we wanted the wires above the modules, but because of the event occlusion that the canvas tag created, we couldn't do a drag/drop (since the targets were always "under" the canvas). Since the wires had to be on the bottom, we then tried making the Pipes' modules themselves semi-transparent. Not only does this give a faded out look to the whole page, but many transparent elements create significant rendering performance issues. We finally picked a solution that kept the wires under the modules and when mouse-overing the canvas containing the wire bounding box, we made the modules connected to either end of the wire in the canvas semi-transparent using animation. This allows parts of the UI to show the wiring flowing around and under modules when the user focuses (by moving the mouse over) on a wire.

If you would like to learn more and talk with us about the pros and cons of canvas and some of the interesting challenges above, visit us at the Developer Sandbox at Google I/O coming up in a couple weeks.
No comments:
Post a Comment