Here is a captivating way to visualize your Google Analytics data in a Treemap visualization and you can visualize your own data with our live demo. (note: IE currently not supported for visualization part)
The goal of this example was to teach people how to use the Google Analytics API on App Engine in Java. As well as demonstrating how to use both OAuth and AuthSub along with the App Engine's various services. The code looked great, but the output was a boring HTML table. So I used some open source tools to transform the table into a pretty tree map visualization!
All the code has been open sourced on Google Project hosting. I also wrote an article describing how this application works making it easy for developers to use this example as a starting point for new data visualizations and other Google Data projects.
For the data retrieval part, this example uses the App Engine Java SDK and the Google Analytics Data Export API Java Client Library to retrieve data from Google Analytics. The example code implements both unsigned AuthSub and registered OAuth authorization methods allowing developers to get up and running quickly in development environments and later switch to a secure authorization method in production environments. The application also uses the Model-View-Controller pattern, making it flexible and allowing developers to extend the code for new applications. (like adding support for other Google Data APIs)
For the visualization part, I used the open-sourced Protovis SVG Visualization Library to create the Treemap. This JavaScript library is maintained by the Stanford Visualization Group and excels at creating brand new visualizations from a data set (in this case a boring HTML table). To handle all of the interactions, including rollover, tooltips and slider controls, I used JQuery. Here is the JavaScript source to the visualization part of the sample.
Enjoy!
By Nick Mihailovski, The Google Analytics API Team
P.S. If you have created any cool new visualizations using the Google Analytics Data Export API, email us so we can highlight them as well.
Custom Search themes make it easy for you to customize the look and feel of your search results pages. And if you want to take the customization gig further, you can also customize the result snippet—a small sample of content that gives search users an idea of what's in the webpage—by using structured data.
When you are reading a webpage that reviews a film, you can figure out what the title is, what reviewers thought of the film, and how they rated it. You can even search for stores with the best prices for the DVD. Structured data can convey the meaning of such key information to computers.
Structured data formats—such as microformats, RDFa, and PageMaps—are semantic markup that you add to your HTML page. Structured data make web content more meaningful to machines. These attributes do not change the formatting of your website, they just make the text enclosed within the XHTML tags "understandable" by computers and influence what shows up in the result snippets.
When you tag your webpages with structured data, Custom Search indexes them and sends the metadata back in the XML results for your page. You can then take this XML feed and transform it into HTML results that showcase key information—such as image thumbnails, summaries, dates, authorship, ratings, and prices. Having the most relevant information in your search results makes the webpages in your site more compelling to your users.
You can, for example, create the following kind of rich snippets:
You can even add thumbnails and actions that let your users download files or make purchases.
If you can select headgear for your LEGO ® action figures, your search engine should let you customize the theme for your search results page, right? Darn tooting!
True, Custom Search already lets you customize the look and feel of your search results page, but we're making it easier. You can now go to the control panel and select one of the predefined themes that broadly matches the look and feel of your website.
If the standard themes are not quite what you want, you can make further changes. You can tinker with the page layout (Why stick with a single column of results, when you can have two?) and play with the font colors and types. The standard themes paired with the "Compact" layout option are optimized for mobile devices, so they work well on iPhone, Android devices, and Pre.
If you want a greater level of control than that, you can download the CSS, tweak it in a text editor, and host the CSS in your website. You can make your search results page blend with the style of the rest of your website.
Today at the eMetrics conference in Washington DC we announced the new Website Optimizer Experiment Management API. The API allows for the creation and management of experiments outside of the Website Optimizer interface.
If you're not familiar with Google Website Optimizer, it's a free tool for running A/B and multivariate experiments on a website. Website Optimizer handles splitting a website's traffic, serving different variations, and crunching the numbers to find statistical significance.
Creating experiments with Website Optimizer usually involves a lot of back and forth between your website and the Website Optimizer interface. Using the API, you can integrate Website Optimizer into your platform. In short, you can create and launch experiments from whatever tool you use to edit your site.
You can also join the Website Optimizer engineers for a webinar on the Website Optimizer Experiment Management API. The webinar will be held on October 28th at 10AM PDT. During the webinar, Website Optimizer engineers will walk you through how the API works. Additionally, two platforms that have already integrated using the API will demonstrate their integrations.
You need to register for the webinar, which you can do here. We'll record the webinar as well so you can reference it later.
We're very excited about the Website Optimizer API and what it means for website testing. Let us know your thoughts in the comments.
By Gary Kačmarčík and Erika Rice Scherpelz, Google Website Optimizer team
This week, we've been celebrating all things mobile across Google. Of course, this wouldn't be complete without a component for mobile web developers! Two months ago we asked you to make the web faster. Now, we've asked the Google Mobile team for some best practices, tips, and resources for mobile web development, and we've come up with a few things we wanted to share. "Go Mobile!" with our Make the mobile web faster article.
I'm excited to announce the Issue Tracker Data API for Project Hosting on Google Code! The Issue Tracker Data API is a Google Data API that you can use to programmatically add new issues, make changes to existing issues, or simply access issues for your open source project.
This means that the issue tracker data for your open source code is now liberated!
To get started with the API, please refer to the following documentation:
If you find yourself digging into the API and creating something useful that others can use, please let us know and we'll be sure to add it to our documentation. As always, your feedback is also welcome.
The team would also like to thank Joe LaPenna, who contributed the Python client for the Issue Tracker Data API in his 20% time.
View Source is a new series where we crack open cool web sites and applications and detail how they were made, step by step. The series will be hosted on Ajaxian, but the Code blog will always carry a link to any new posts that come out in the series. We hope that the articles will help you understand how developers out there are using HTML5 and other Open Web technologies.
Here are links to two articles from this series that were published over the last few days:
When we launched Mercurial support our goal was to get to a point where we could enable a social coding experience. Today, I am happy to announce that today we have support for both 'project' clones and 'user' clones.
Project owners can now create multiple repositories for their project, and they can choose to make any of those new repositories a clone of any of the project's other repositories. These project clones share the same commit access permissions as the original project and make it easier for project members to work together on new features. A common pattern in the Mercurial world is to place each "official" branch into a separate repository with naming conventions like "project-crew", "project-stable", and so on.
In addition to project clones, any user can visit any Mercurial repository and create a server-side user clone of that repository, without asking permission from the project owner. These personal user clones can be easily shared with other developers -- who also can make a clone of that clone. Once a user has finished her changes in a user clone, she can coordinate with the canonical project's contributors to review and incorporate her changes.
User clones aren't forks, in the traditional sense, where a fork has little intention to contribute back to the original project. Rather, the entire purpose of a user clone is to allow users to contribute to projects without requiring official commit access permissions. Because mercurial is a distributed (peer-to-peer) version control system, it excels at branching and merging. If the project maintainers like the new code, they just "pull" the changesets from the clone and merge them into an official project repository. It's all much more elegant than emailing patches back and forth, anonymous contributors get to use the same tools as core developers.
The instructions for creating a user clone can be found on the checkout page for any Mercurial project (e.g. twisty) and existing clones for a project can be found under the Clones sub-tab under Source.
Please let us know if you have any feedback or find any issues. Happy cloning!
By Nathaniel Manista and Jacob Lee, Project Hosting on Google Code
We launched code.google.com/speed in June, to give web developers access to tools and resources that help them improve the performance of their applications. Since then, the developer community provided us with plenty of suggestions on how to improve our site. Based on your feedback, we made the following improvements:
We added new content:
Four new best practice articles on topics such as optimizing JavaScript
Two new tech talks on new developer tools
A blog gadget that aggregates performance related posts from Google blogs.
We improved the layout to make navigation between different tutorials, tech talks and tools smoother.
Just as making the web faster is an ongoing process, we plan to continue updating and enhancing code.google.com/speed with more resources. Currently, we are focusing on increasing community involvement, such as adding more tutorials and tech talks from non-Google authors. So, as a first step, if you have recently written an interesting article on web performance, please let us know by filling in this form. Our team will evaluate all entries and may contact you for potential next steps.
At Google we're excited about new web technologies like HTML 5, CSS 3, Web Fonts, SVG, faster JavaScript, and more. It's an exciting time to be a web developer, especially with the major advancements made in modern browsers like Firefox, Safari, Opera, and Chrome the last two years. In this blog post I want to share some of the work we've been doing with SVG in particular.
Today kicks off the start of the SVG Open 2009 conference, hosted at Google this year. The SVG Open conference is an annual conference where the SVG community comes together for three-days. Other sponsors of the conference this year include Microsoft and IBM.
What is SVG?
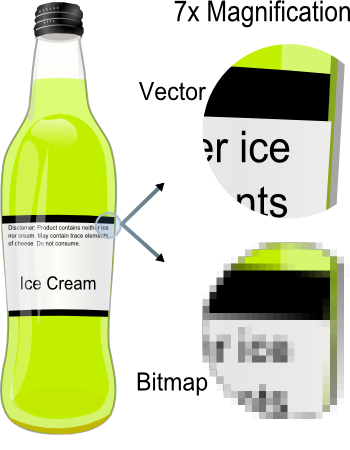
SVG, or Scalable Vector Graphics, is an open web standard that makes it easy to add interactive vector graphics to your web pages. Vector graphics, as opposed to bitmap graphics like JPG, GIF, or PNG files, describe the shapes on your screen with mathematical equations rendered by your computer rather than pixels. This allows vector graphics to stay beautiful and crisp whether displayed on a 40" monitor or a small mobile device.
Just as HTML gives you simple tags such as <form> or <table> to add to your web pages, SVG gives you such graphical tags as <circle> or <rect> for a rectangle that you can drop into your web page. Working with SVG is very similar to working with HTML - you use JavaScript to animate and make things interactive, CSS (Cascading Style Sheets) to add style, etc.
Why Google is Excited About SVG
We're excited about SVG for a host of reasons:
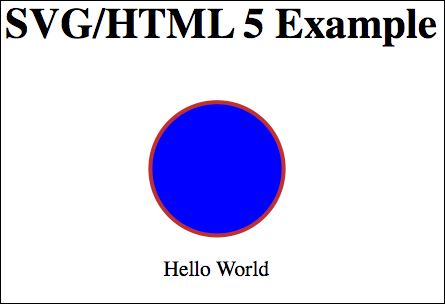
First, SVG is part of the HTML 5 family of technologies. One of the major new features of HTML 5 is the fact that you can now drop SVG tags into normal HTML, directly embedded into your page. We're excited about how this will empower developers. Here, for example, is a small code sample that embeds an SVG circle and rectangle right into an HTML 5 page:
Second, we like that SVG is composed of text and markup, just like HTML. Because it's markup, search engines have a much easier time working with SVG; server-side languages like PHP or Google App Engine can simply emit SVG just like they generate HTML; and users and developers can easily view the source just like a normal web page to learn and move things forward. It's also easy to import and export SVG into tools like the open source Inkscape drawing package or Adobe Illustrator.
Third, the compact size of SVG when combined with HTTP GZip compression can easily make the images on a page roughly an order of magnitude smaller, and when directly embedded into an HTML 5 page can decrease the latency of a page by reducing the number of fetches. Small and fast are definitely two things we like at Google, and we like that SVG helps enable both.
Fourth, SVG integrates with the rest of the web stack, including JavaScript, CSS, and the DOM (Document Object Model). Even better, developers can easily adapt the skills they already know when working with SVG.
Finally, SVG is an open standard that is vendor-neutral. It also has accessibility built in, so when screen readers start to work with SVG your content will be future-proofed with accessibility baked in. We also like that SVG is now natively supported on all modern browsers, including the iPhone.
What Are Some Places We Use SVG?
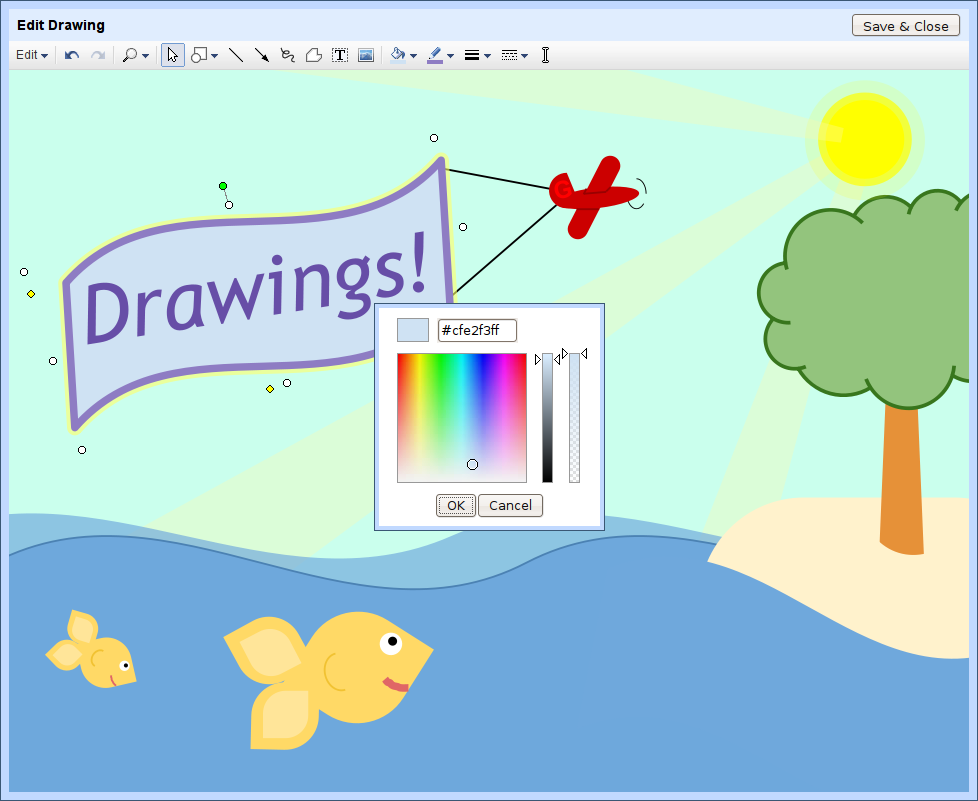
We use SVG ourselves in a range of products. In Google Docs, for example, you can insert drawings, illustrations, and diagrams using a built in drawing tool:
On all browsers we use SVG to build this user interface; on Internet Explorer we have to revert to an older technology named Vector Markup Language (VML) unfortunately.
Another example is the Google Visualization API, which lets you access multiple sources of structured data that you can display, choosing from a large selection of visualizations. Some of these visualizations (such as this one and this one) use SVG to do their drawing on all browsers except Internet Explorer.
Canvas Or SVG? Oh My!
A natural question is how SVG compares to the Canvas tag. In our opinion both are needed for the web and are suitable for different applications.
The Canvas tag can best be thought of as a scriptable image tag that you build up yourself using JavaScript. This means it is lower-level, requiring you to keep track of all objects you have placed on the canvas. This can be a benefit if you want to do a large degree of non-interactive animation, but can quickly become a burden if you need to build sophisticated user interfaces.
SVG, meanwhile, is higher-level, doing the bookkeeping necessary to keep track of where everything is, making things like mouse interaction much easier. If you don't need this interaction, however, the overhead imposed by SVG can get in the way of certain applications. Because SVG is markup, importing and exporting is much easier, including SEO and accessibility.
We believe that Canvas versus SVG is a false dichotomy. A great example of both technologies working together is the Firefox Download Tracker. This page shows real time updates across the world whenever a copy of Firefox is downloaded. SVG is used to draw the map of the world; this is an appropriate use, since we don't want thousands of lines of JavaScript for this but rather markup from a tool like Inkscape. Red circles are drawn on top of the SVG using the Canvas tag as copies are downloaded; this is perfect for Canvas as the circles are non-interactive and might number in the thousands if copies are being downloaded rapidly.
SVG In Internet Explorer and in Wikipedia
Now that you know a bit more about SVG, why we like it, and some of the places we use it, let me tell you a bit about some of the work we've been doing to support SVG lately.
In addition to hosting this years conference, we are also helping to address the fact that SVG can't be used on Internet Explorer. It's hard for developers to use new web technologies if they can't deploy them on IE. In response to this, we've been working with others in the open source community on a drop-in JavaScript library named SVG Web that brings SVG to Internet Explorer.
SVG Web cleverly uses existing facilities on Internet Explorer 6, 7, and 8 to instantly enable SVG support without the user having to download any new software or plugins. Using SVG Web plus native SVG support you can now target close to 100% of the existing installed web base, today. Before SVG Web you could only target about ~30% of web browsers with SVG.
Once dropped in SVG Web gives you partial support for SVG 1.1, SVG Animation (SMIL), Fonts, Video and Audio, DOM and style scripting through JavaScript, and more in about a 60K library. Your SVG content can be embedded directly into normal HTML 5 or through the OBJECT tag. If native SVG support is already present in the browser then that is used. No downloads or plugins are necessary other than Flash which is used for the actual rendering, so it's very easy to use and incorporate into an existing web site. Here's a quick one minute introduction to SVG Web:
SVG Web is currently in alpha and is a developer release. It's also important to note that it is a collaboration with many others in the open source community outside Google, including Rick Masters at F5 Networks and James Hight at Zavoo Labs. Google is just one participant in this open source project. Finally, a JavaScript library will never be as fast as native support; this doesn't take Internet Explorer off the hook for needing to implement SVG, but it does help developers in the here and now deploy their SVG today to get the wheel turning.
In addition to helping enable SVG on Internet Explorer, we've been working with Wikipedia. Wikipedia has an impressively large collection of SVG files that are under Creative Commons licenses. Every one of these files is available in the Wikimedia Commons; for example here is the Linux penguin Tux as SVG. We've been working with Wikipedia to enable interactive zooming and panning of these SVG files, similar to Google Maps; even better, this functionality works in Internet Explorer thanks to the SVG Web library on the sixth largest site on the web.
Today at the SVG Open show we are demoing a prototype of the Wikipedia SVG Zoom and Pan tool; deployment to the wider base of Wikipedia users will happen after the conference and an appropriate QA period. Here's a screencast showing the tool in action:
We hope you are as excited as we are about SVG and other new web technologies in the pipeline!


